

Unlock the full potential of your sales team with these essential performance metrics to track. Discover how to optimize your sales strategy and drive better results.
The Importance of Tracking Sales Team Performance
Tracking sales team performance is essential for the success of any business. By monitoring and analyzing the performance of your sales team, you can identify strengths and weaknesses, make data-driven decisions, and take proactive steps to improve performance.
One of the key reasons why tracking sales team performance is important is that it allows you to identify top performers and replicate their success. By analyzing the performance of your top salespeople, you can uncover the strategies and techniques that are driving their success. You can then share these best practices with the rest of your team and help them improve their performance.
Tracking sales team performance also helps you identify areas for improvement and implement targeted training and development programs. By analyzing performance metrics such as conversion rates, average deal size, and sales cycle length, you can identify specific areas where your team is underperforming. This allows you to provide targeted training and support to help your team improve in those areas.
In addition, tracking sales team performance enables you to measure the effectiveness of your sales strategies and make data-driven decisions. By monitoring key performance indicators (KPIs) such as revenue, deals closed, and sales activity, you can assess the impact of different strategies and tactics. This allows you to make informed decisions about where to invest your time, resources, and efforts.
Overall, tracking sales team performance is crucial for optimizing your sales strategy and driving better results. It helps you identify top performers, uncover best practices, target training and development, and make data-driven decisions. By leveraging the power of data, you can unlock the full potential of your sales team and achieve your business goals.
Identifying Key Performance Indicators (KPIs)
Identifying key performance indicators (KPIs) is a critical step in tracking sales team performance.
KPIs are specific metrics that help you measure the success of your sales efforts and align them with your business goals.
By identifying the right KPIs, you can focus on the metrics that matter most and make data-driven decisions to improve performance.
When it comes to identifying KPIs for your sales team, it's important to consider both leading and lagging indicators.
- Leading indicators are predictive metrics that help you anticipate future performance. They are often activity-based metrics, such as the number of calls made or meetings scheduled.
- Lagging indicators, on the other hand, are outcome-based metrics that measure past performance, such as revenue or deals closed.
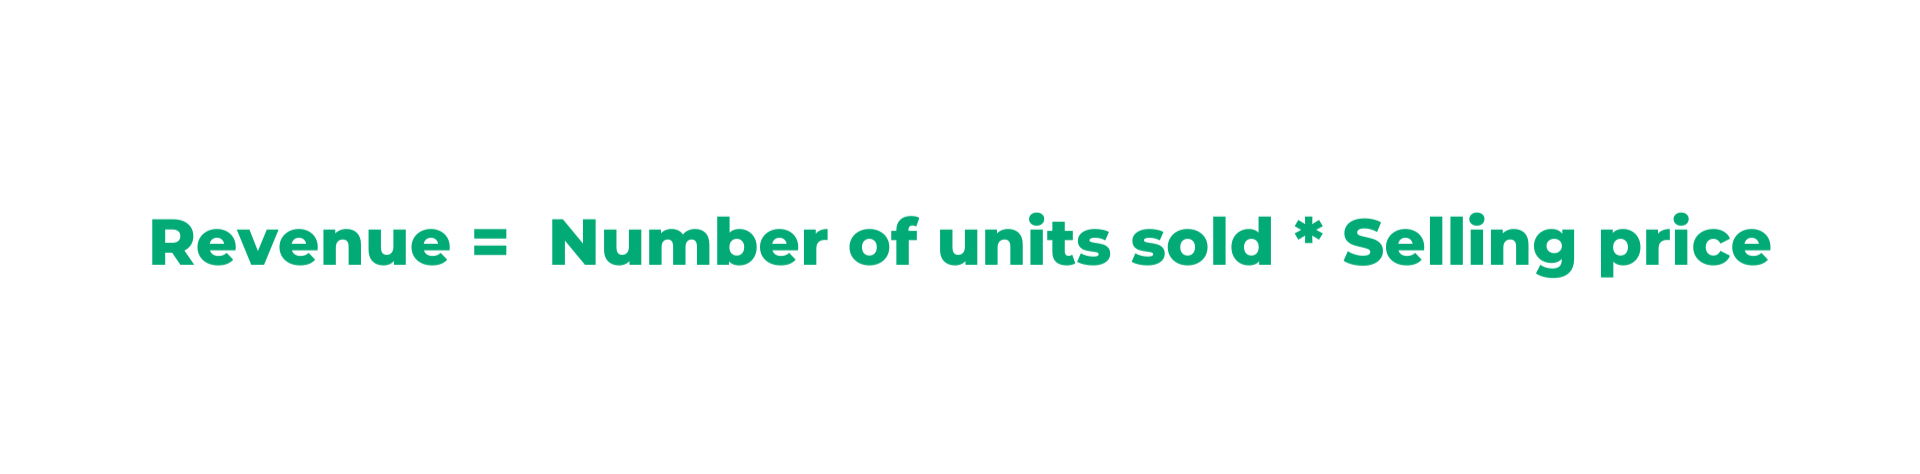
Some common KPIs for tracking sales team performance include revenue, conversion rates, average deal size, sales cycle length, and sales activity. Revenue is a key indicator of overall sales performance and business success. Conversion rates measure the percentage of leads or prospects that convert into customers. Average deal size helps you understand the value of each sale and identify opportunities for upselling or cross-selling. Sales cycle length measures the time it takes to close a deal, while sales activity tracks the number of calls, meetings, and demos conducted by your team.
To identify the right KPIs for your sales team, it's important to align them with your business goals and objectives. Consider what metrics are most relevant to your industry, target market, and sales process. Also, involve your sales team in the process and get their input on which metrics they believe are most important for tracking their performance. By selecting the right KPIs, you can effectively measure and improve your sales team's performance.
Tracking Sales Conversion Rates
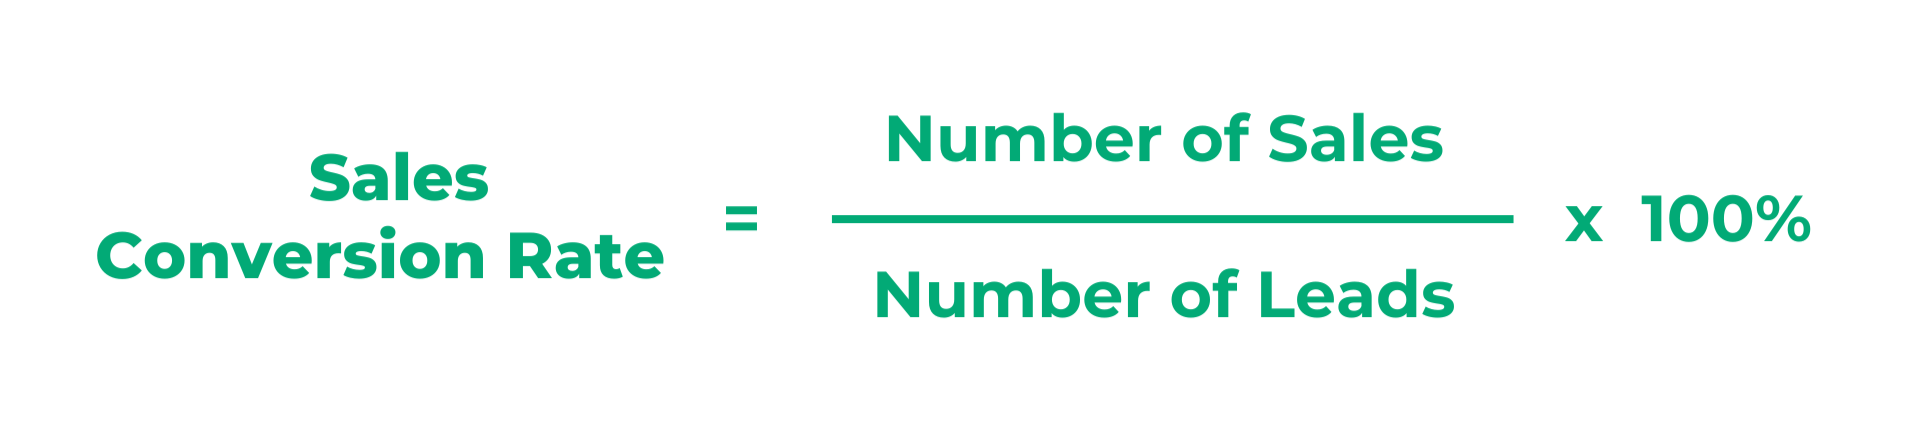
Tracking sales conversion rates is crucial for measuring the effectiveness of your sales efforts and optimizing your sales strategy. Conversion rates measure the percentage of leads or prospects that convert into customers. By tracking conversion rates, you can identify areas where your team is excelling and areas where improvement is needed.
One of the main benefits of tracking sales conversion rates is identifying bottlenecks in your sales process. If you notice a low conversion rate at a specific stage of the sales funnel, there may be issues or obstacles preventing leads from progressing. By identifying these bottlenecks, you can take steps to address them and improve your conversion rates.
Tracking sales conversion rates also allows you to identify top performers and replicate their success. By analyzing the conversion rates of your top salespeople, you can uncover the strategies and techniques driving their success. You can then share these best practices with the rest of your team and help them improve their conversion rates.
Furthermore, tracking sales conversion rates enables you to measure the impact of different sales strategies and tactics. By comparing conversion rates before and after implementing a new strategy, you can assess its effectiveness and make data-driven decisions about whether to continue or modify it. This helps you optimize your sales strategy and allocate your resources more effectively.
In summary, tracking sales conversion rates is essential for optimizing your sales strategy and driving better results. It helps you identify bottlenecks, replicate success, and measure the impact of different strategies. By continuously monitoring and improving your conversion rates, you can unlock the full potential of your sales team and achieve your business goals.
Measuring Average Deal Size
Measuring average deal size is important for tracking sales team performance and identifying growth opportunities. It measures the value or revenue generated by each sale. You can identify trends, uncover opportunities, and make data-driven decisions to improve performance by measuring and analyzing average deal size.

One of the main benefits of measuring average deal size is the ability to identify upselling and cross-selling opportunities. By analyzing your sales team's average deal size, you can identify customers who have the potential to purchase additional products or services. This allows you to tailor your sales approach and maximize the value of each sale.
Measuring average deal size also helps you identify trends and patterns in your sales data. For example, suppose you notice that the average deal size has increased over time. In that case, it may indicate that your team is successfully targeting higher-value customers or selling more expensive products. On the other hand, if the average deal size is decreasing, it may suggest that your team is struggling to close larger deals or facing pricing challenges.
Furthermore, measuring average deal size enables you to assess the effectiveness of your pricing and discounting strategies. By analyzing the impact of different pricing or discounting approaches on average deal size, you can determine which strategies are most effective in maximizing revenue and profitability. This allows you to refine your pricing strategy and optimize your sales process.
In conclusion, measuring average deal size is crucial for tracking sales team performance and identifying growth opportunities. It helps you uncover upselling and cross-selling opportunities, identify trends in your sales data, and assess the effectiveness of your pricing strategies. By leveraging the power of average deal size, you can drive better results and achieve your sales goals.
Analyzing Sales Cycle Length
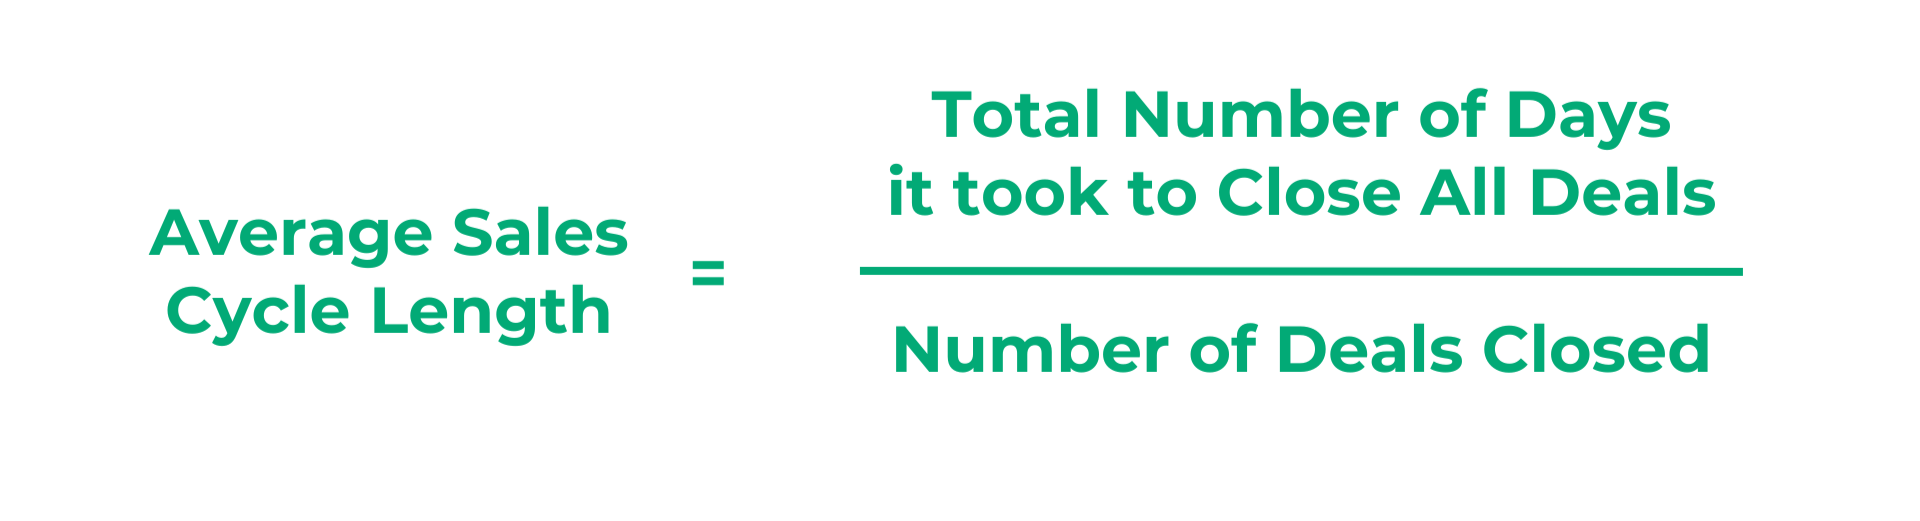
Analyzing sales cycle length is essential for understanding the efficiency of your sales process and making data-driven decisions to improve performance. Sales cycle length measures the time it takes to close a deal, from the initial contact with a lead to the final sale. By analyzing sales cycle length, you can identify areas where your team excels and areas where improvement is needed.
One of the main benefits of analyzing sales cycle length is the ability to identify bottlenecks or delays in your sales process. If you notice that the sales cycle length is longer than expected at a specific stage, it indicates that there may be issues or obstacles preventing leads from progressing further. By identifying these bottlenecks, you can take steps to address them and streamline your sales process.
Analyzing sales cycle length also helps you identify top performers and replicate their success. By analyzing the sales cycle length of your top salespeople, you can uncover the strategies and techniques that are driving their efficiency. You can then share these best practices with the rest of your team and help them improve their sales cycle length.
Furthermore, analyzing sales cycle length enables you to measure the impact of different sales strategies and tactics. By comparing sales cycle length before and after implementing a new strategy, you can assess its effectiveness and make data-driven decisions about whether to continue or modify it. This helps you optimize your sales strategy and allocate your resources more effectively.
In summary, analyzing sales cycle length is crucial for understanding the efficiency of your sales process and driving better results. It helps you identify bottlenecks, replicate success, and measure the impact of different strategies. By continuously monitoring and improving your sales cycle length, you can unlock the full potential of your sales team and achieve your business goals.
Monitoring Sales Team Activity
Monitoring sales team activity is essential for tracking your sales team's productivity and effectiveness. Sales team activity measures the number of calls, meetings, demos, and other sales-related activities performed by your team. By monitoring sales team activity, you can identify areas where your team excels and areas where improvement is needed.
One of the main benefits of monitoring sales team activity is the ability to identify top performers and replicate their success. By analyzing the activity levels of your top salespeople, you can uncover the strategies and techniques driving their productivity. You can then share these best practices with the rest of your team and help them improve their activity levels.
Monitoring sales team activity also helps you identify areas for improvement and implement targeted training and development programs. You can identify specific areas where your team is underperforming by analyzing activity metrics such as the number of calls made or meetings scheduled. This allows you to provide targeted training and support to help your team improve in those areas.
Furthermore, monitoring sales team activity enables you to measure the effectiveness of your sales strategies and tactics. By comparing activity levels before and after implementing a new strategy, you can assess its impact on productivity and make data-driven decisions about whether to continue or modify it. This helps you optimize your sales strategy and allocate your resources more effectively.
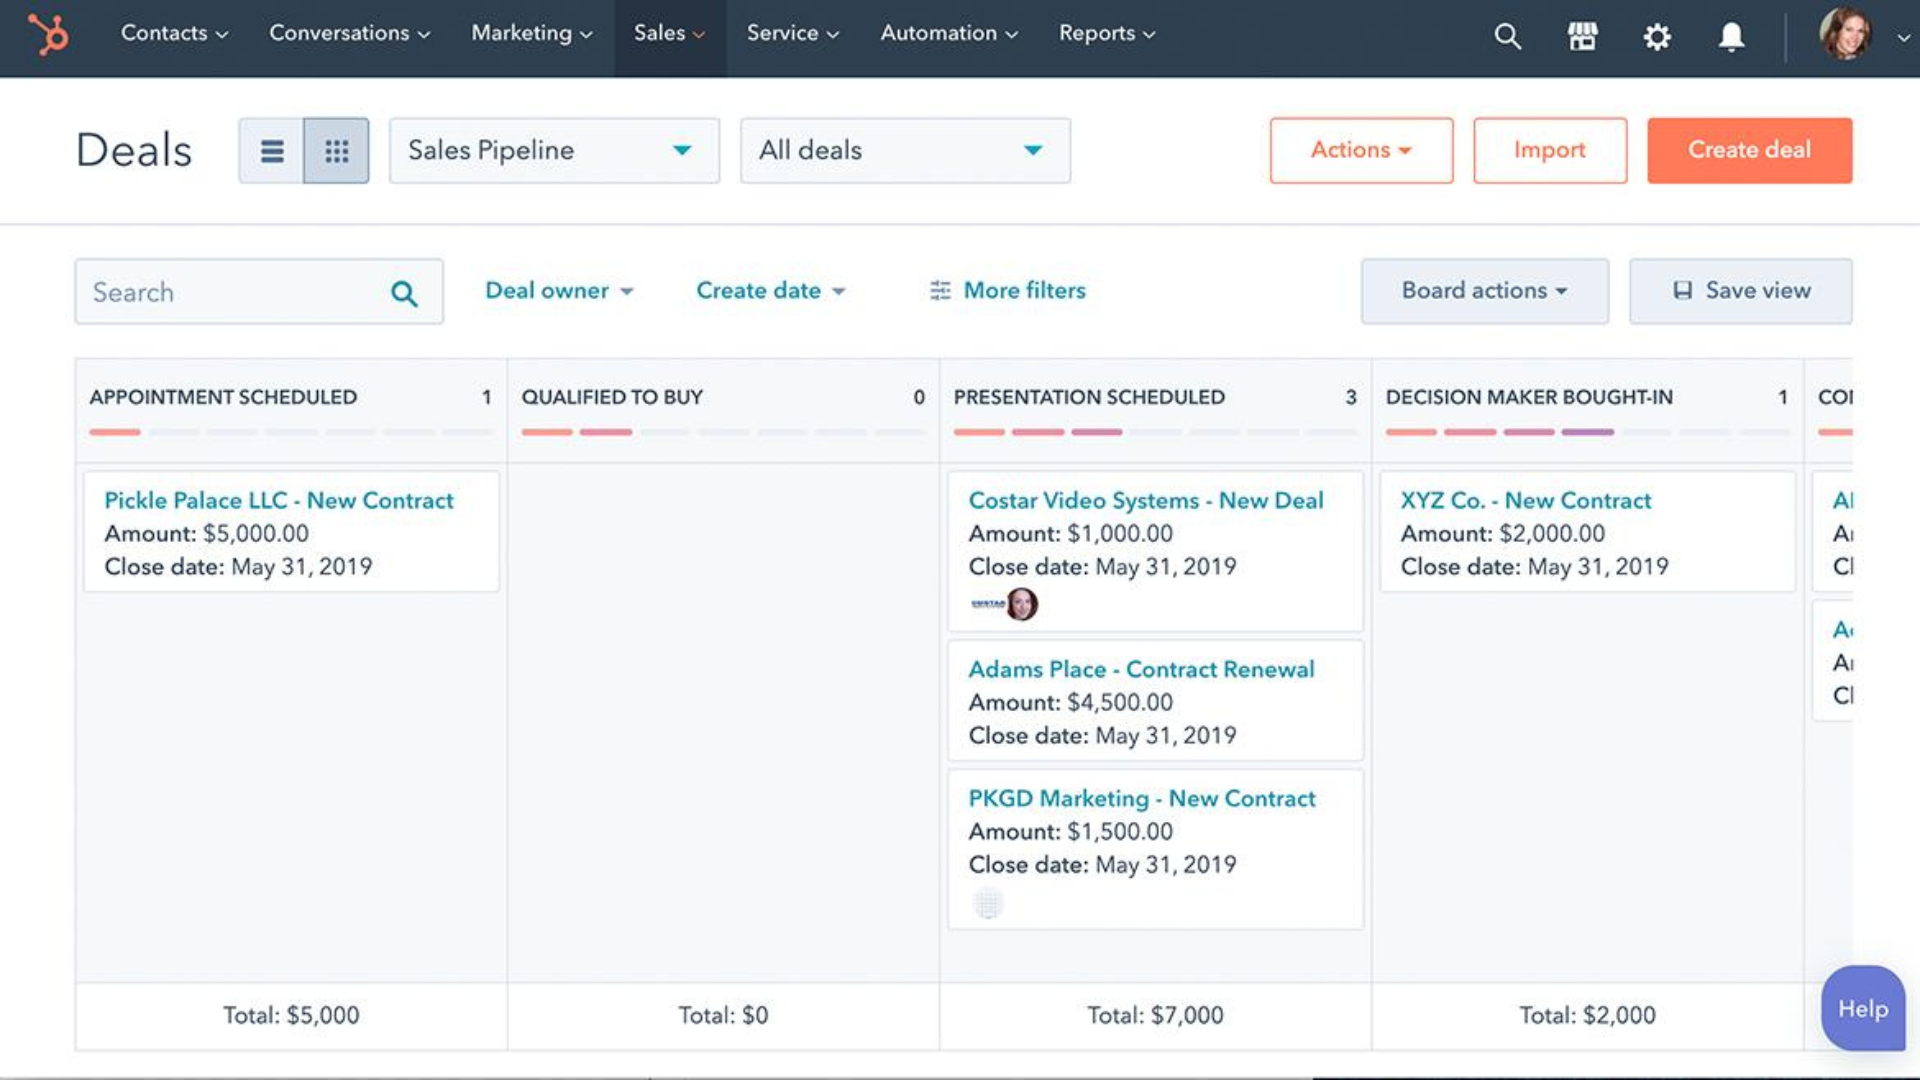
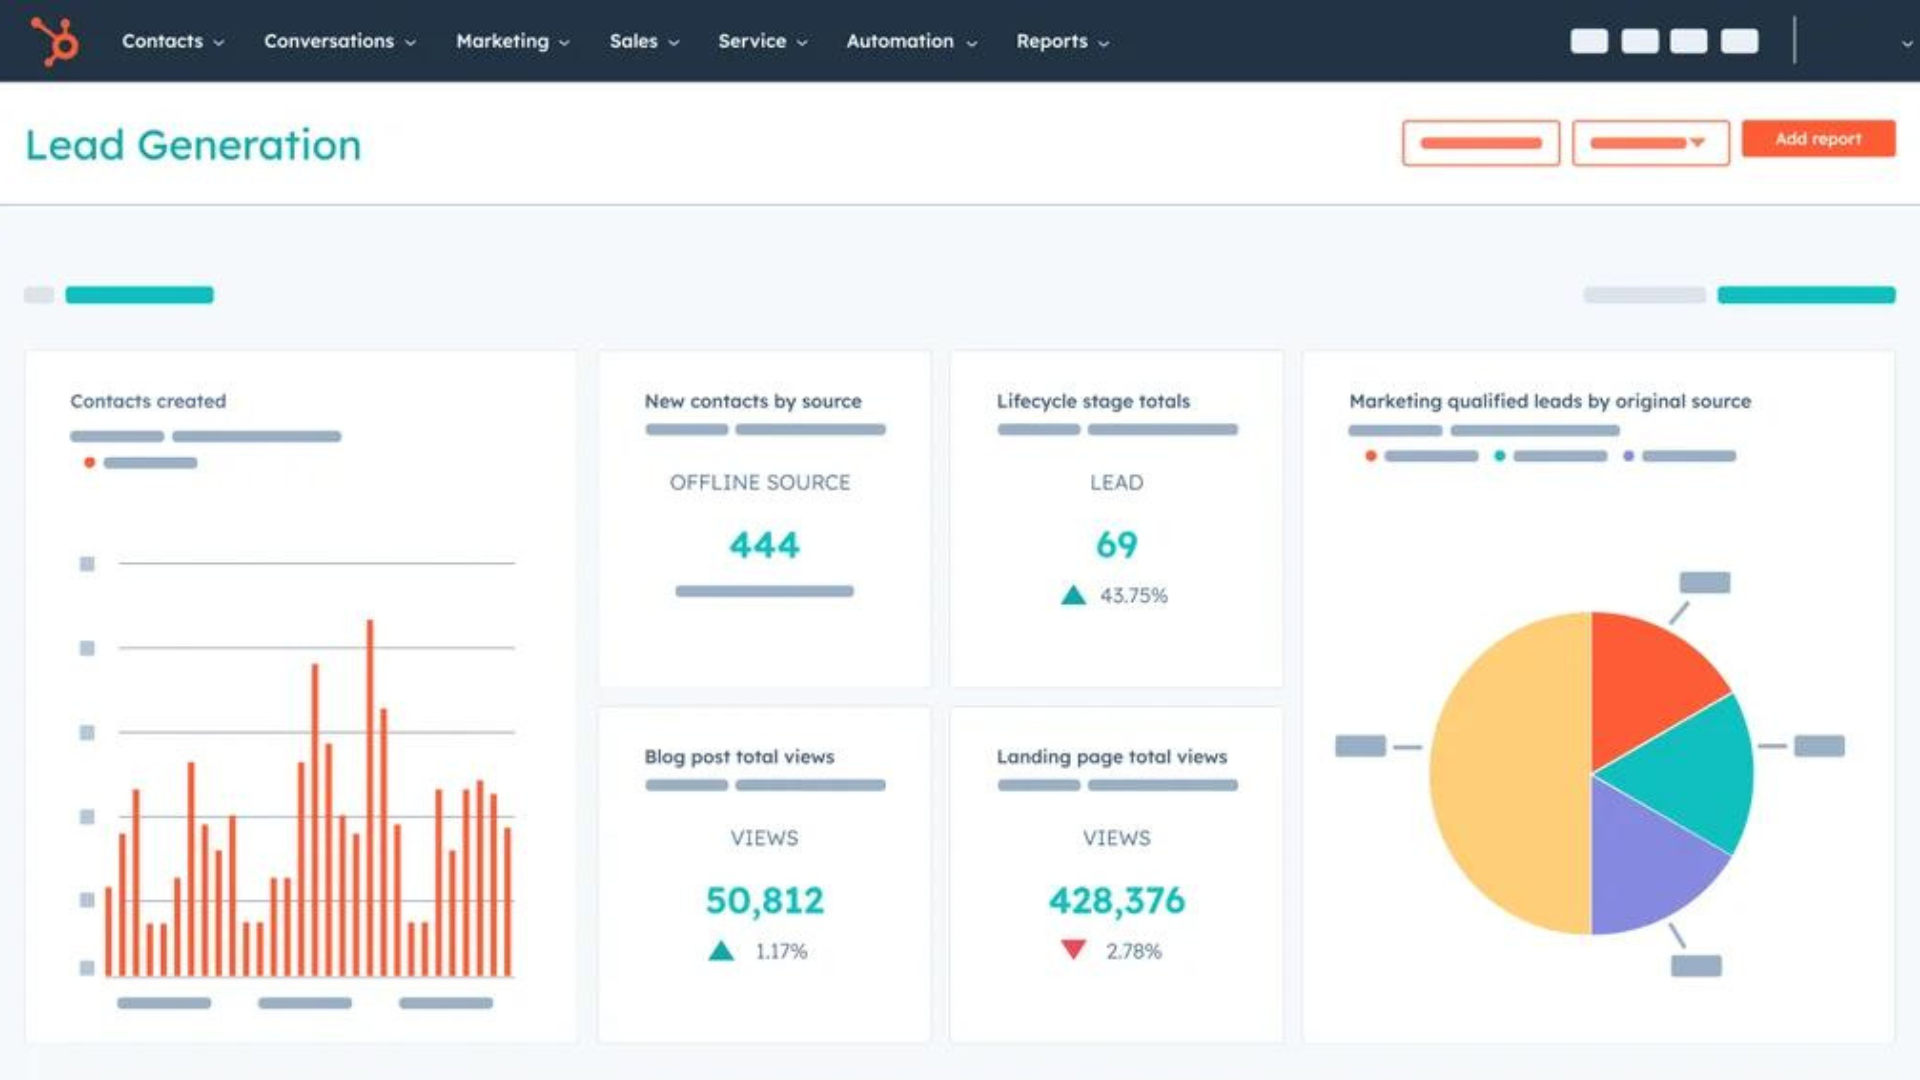
Sales team performance dashboard in HubSpot
The sales team performance dashboard in HubSpot is a powerful tool for monitoring and analyzing your sales team's performance. This dashboard lets you track key metrics such as revenue, deals closed, and sales activity. It provides a comprehensive overview of your team's performance and helps you identify areas for improvement.
One of the main advantages of using the sales team performance dashboard in HubSpot is the ability to visualize data in real time. You can see how your team performs at any moment and make adjustments as needed. This real-time data allows you to quickly identify any issues or bottlenecks in your sales process and take immediate action to address them.
The sales team performance dashboard in HubSpot provides real-time data and historical data and trends. You can analyze past performance and identify patterns or trends that can help you make better decisions for the future. For example, if your team's conversion rates have been declining over time, you can investigate the possible causes and implement strategies to improve them.
Furthermore, the sales team performance dashboard in HubSpot allows you to set goals and track progress toward those goals. You can set specific targets for your team, such as increasing revenue by a certain percentage or closing several deals each month. The dashboard will show you how close you are to achieving those goals and help you stay on track.
Overall, the sales team performance dashboard in HubSpot is an invaluable tool for improving sales team performance. It provides real-time data, historical analysis, and goal-tracking capabilities that can help you optimize your sales strategy and drive better results.
If you need assistance setting up and configuring HubSpot's Sales Hub to track all your sales metrics and KPIs in one place, please do not hesitate to contact Velainn. Our team will be happy to assist you. Schedule the free 15-minute call now: https://velainn.com/contact
Data illustrations by Storyset