
The process of reporting sales is crucial in analyzing the sales team’s performance. Similarly, businesses create a report that displays quarterly sales by territory for more precise tracking. These quarterly sales reports have become business essential, and experts use them to strategize and undertake various business decisions.
Create a report that displays the quarterly sales by territory – Step-by-step guide
In order to validate and better understand the sale processes and outcomes of your business, relevant sales reports are very helpful. They can help implement the right sales processes, which is crucial for business growth. This step-by-step guide will help you create a report that displays quarterly sales by territory.
Data Collection
The first step in creating a report that displays quarterly sales by territory is to gather relevant sales data. Accurate territorial sales data included in your report plays a major role in determining the effectiveness of your report. After collecting the data necessary to create a report, you can move towards data entry.
Data Entry
After collecting the data, you need to enter the data into a spreadsheet. You can use any data analyzing software like Microsoft Excel or Google Spreadsheet. This data should be properly organized to have an efficient report-building experience. In this guide, Microsoft Excel is used to show the procedure.

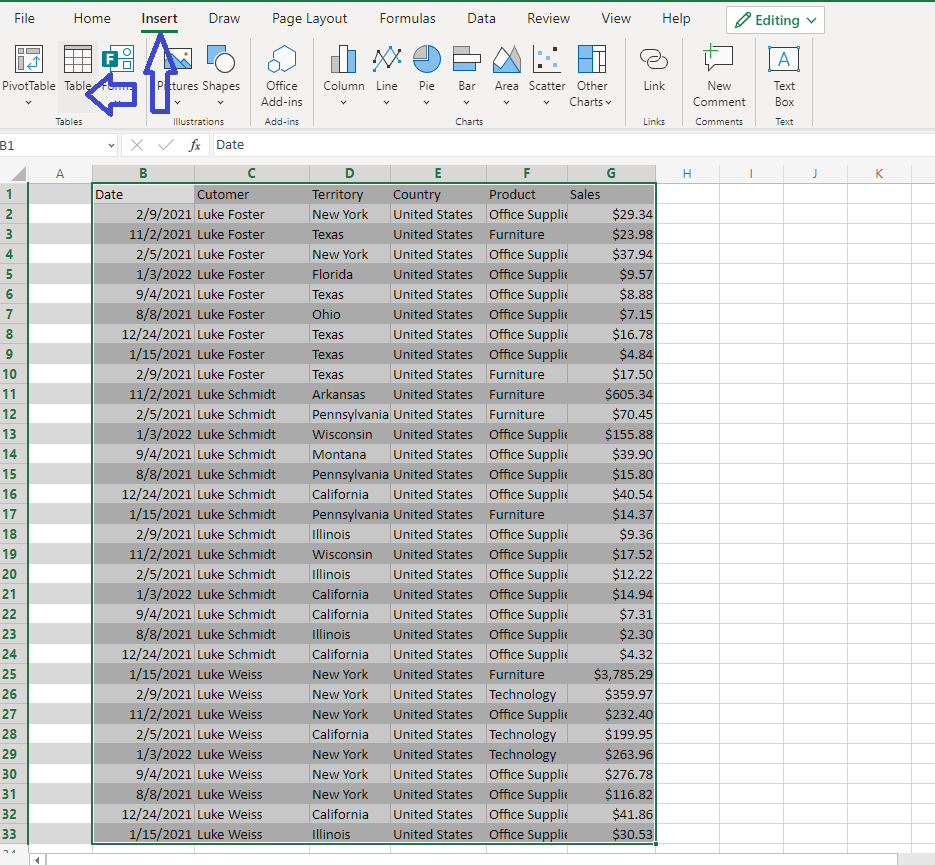
If the data after collection is not in a table form, you can simply select a cell, go to the “Insert” tab and click on the “tables” tab in the command section. After that, click “OK,” and your sales data will be converted into a table.
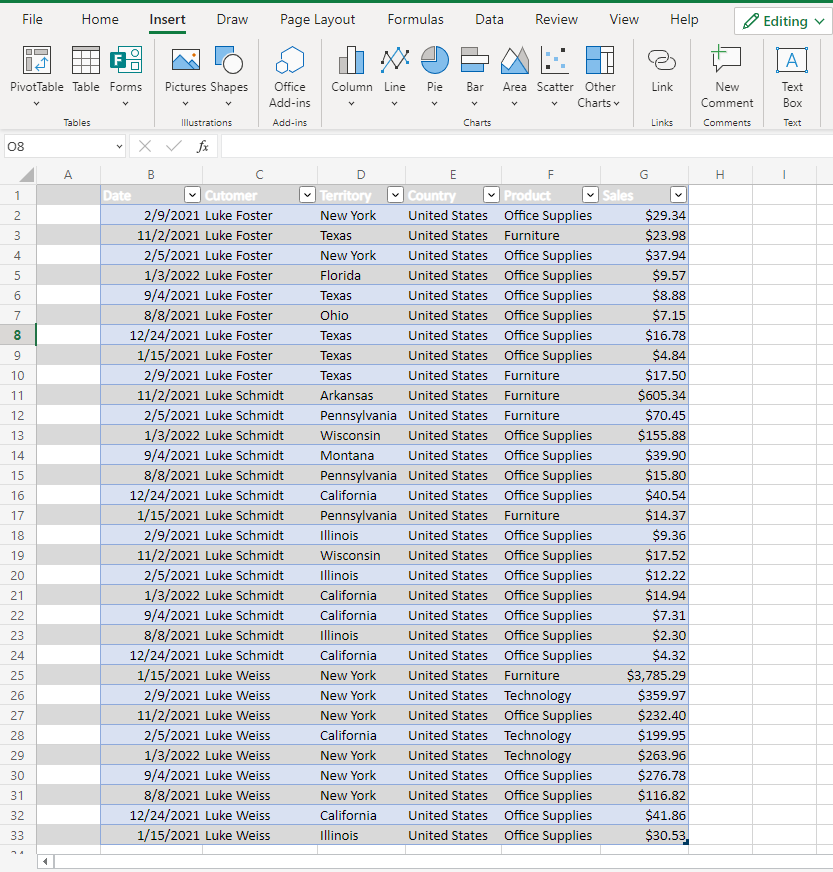
You can name this table by going into “Name Box” and further customize this table by going into the “Design” tab to distinguish multiple tables easily. You can choose from various color and formatting options. Screenshots below show the how-to instructions and the difference between data with and without converting into table form.
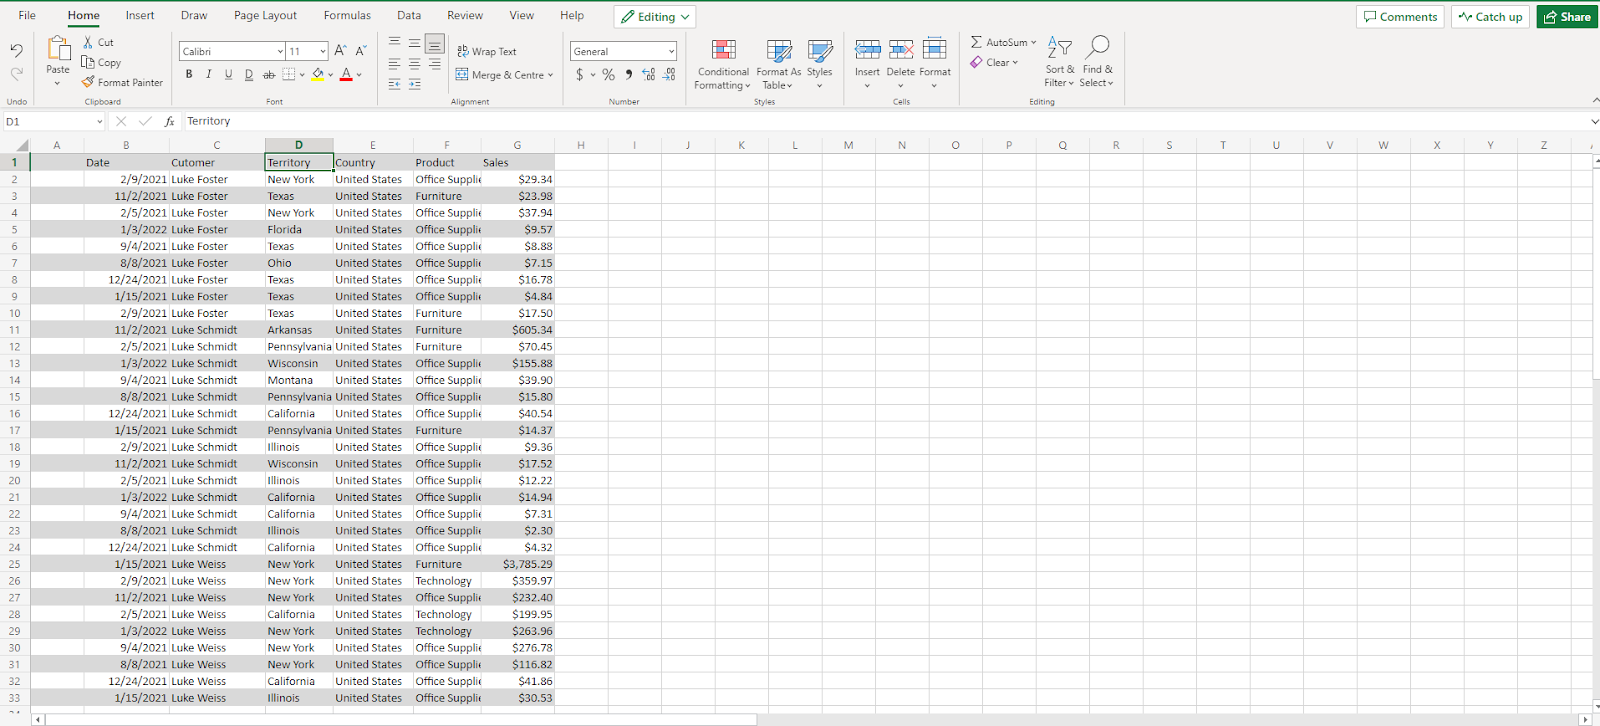
This guide shows sample sales data to demonstrate how you can convert this data into a comprehensive report. This data contains various columns that provide general sales information required to create a report.
Insert PivotTable
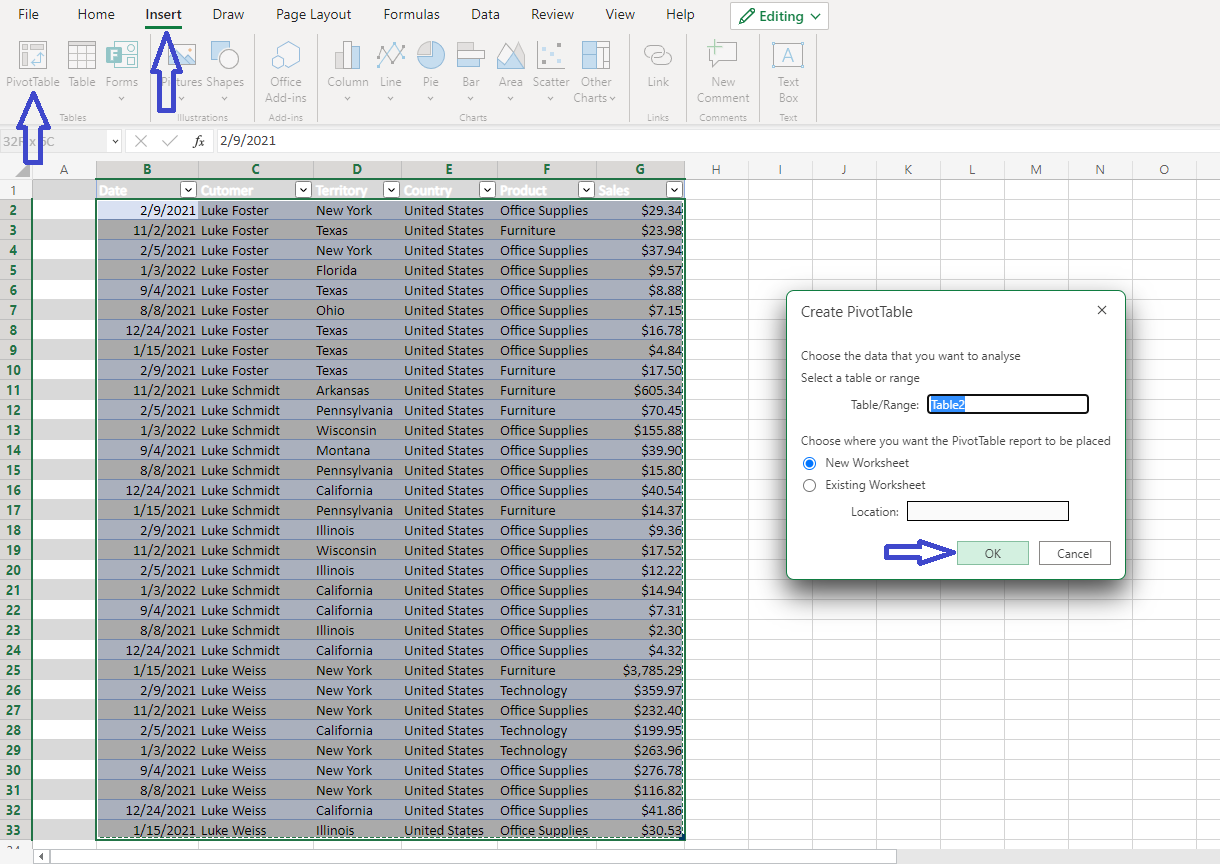
The next step after having your data organized in a table form is to create a Pivot Table. To do that, select your data from the table, click on the “Insert” tab, and add “PivotTable” from the tables command center.
Doing so will show a “Create PivotTable” customization box, where the name of your table and the location of the PivotTable report will be mentioned. Check on “New Worksheet” to have your pivot table created in a separate worksheet for simplicity. After clicking “OK,” a worksheet will be created on which “PivotTable Fields” will be mentioned.
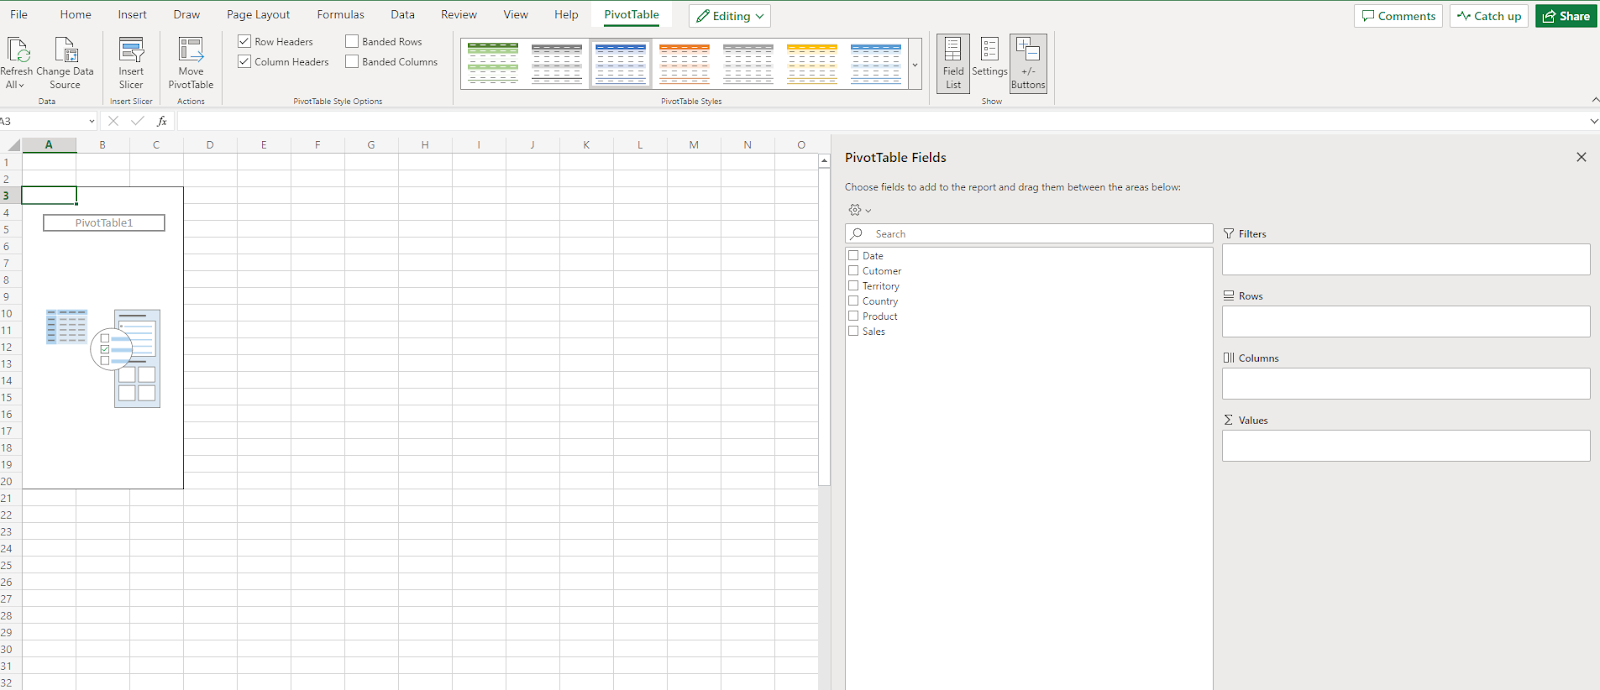
PivotTable customization
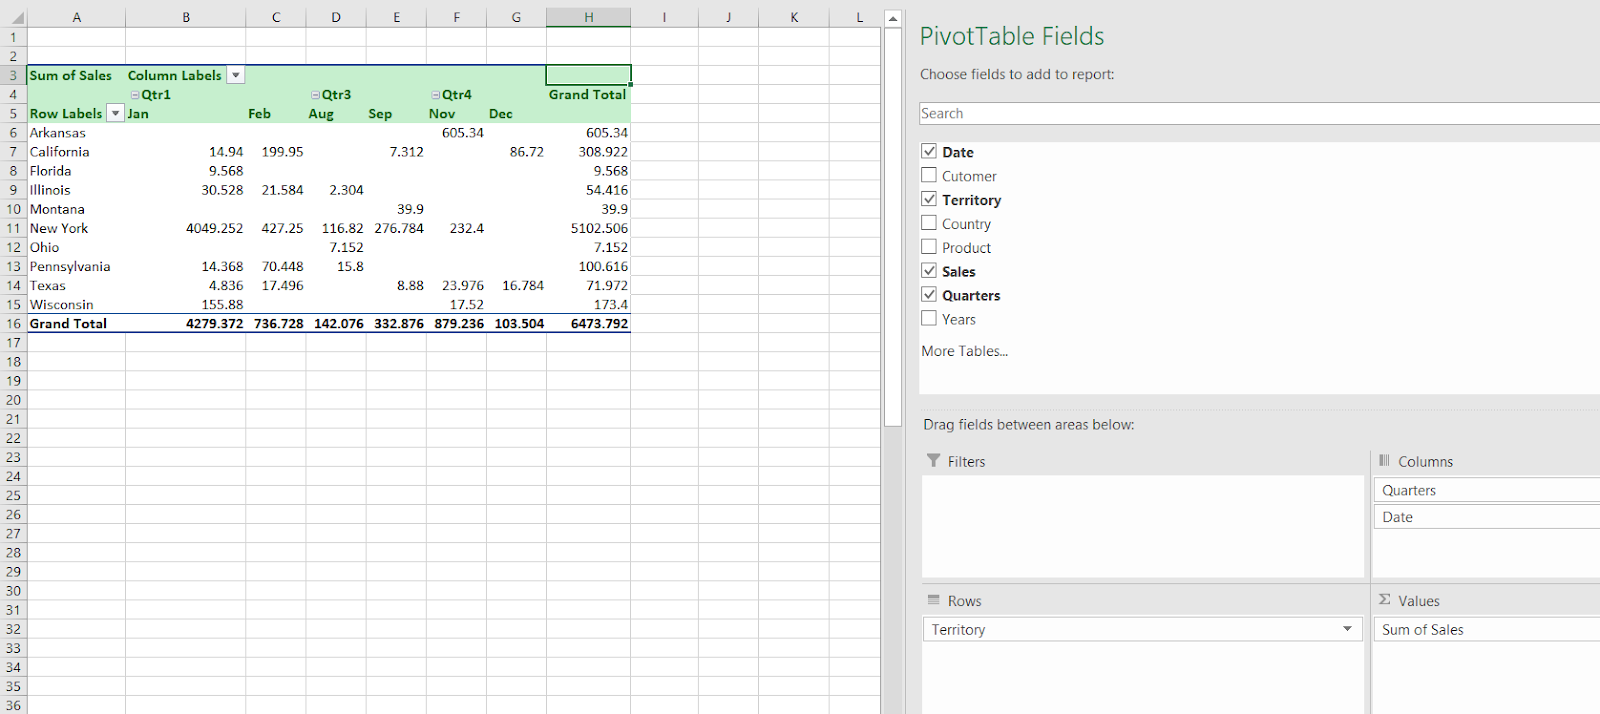
Various options in the menu of “PivotTable Fields” can help you add customizability when you create a report that displays quarterly sales by territory. You can enable specific options to focus your report on the desired field.
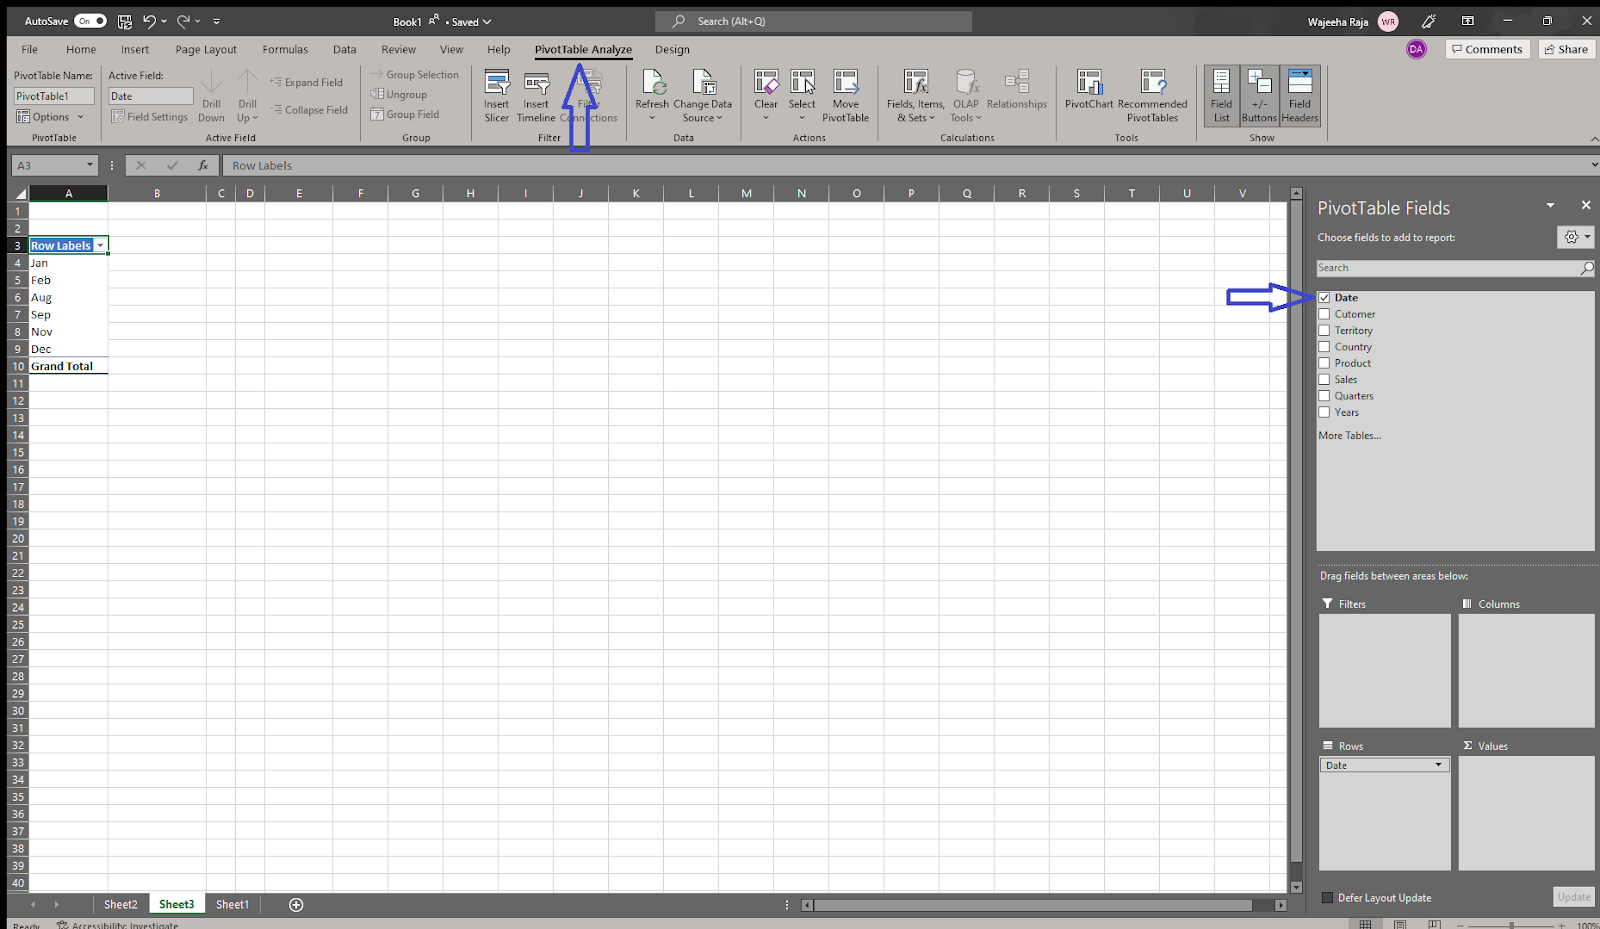
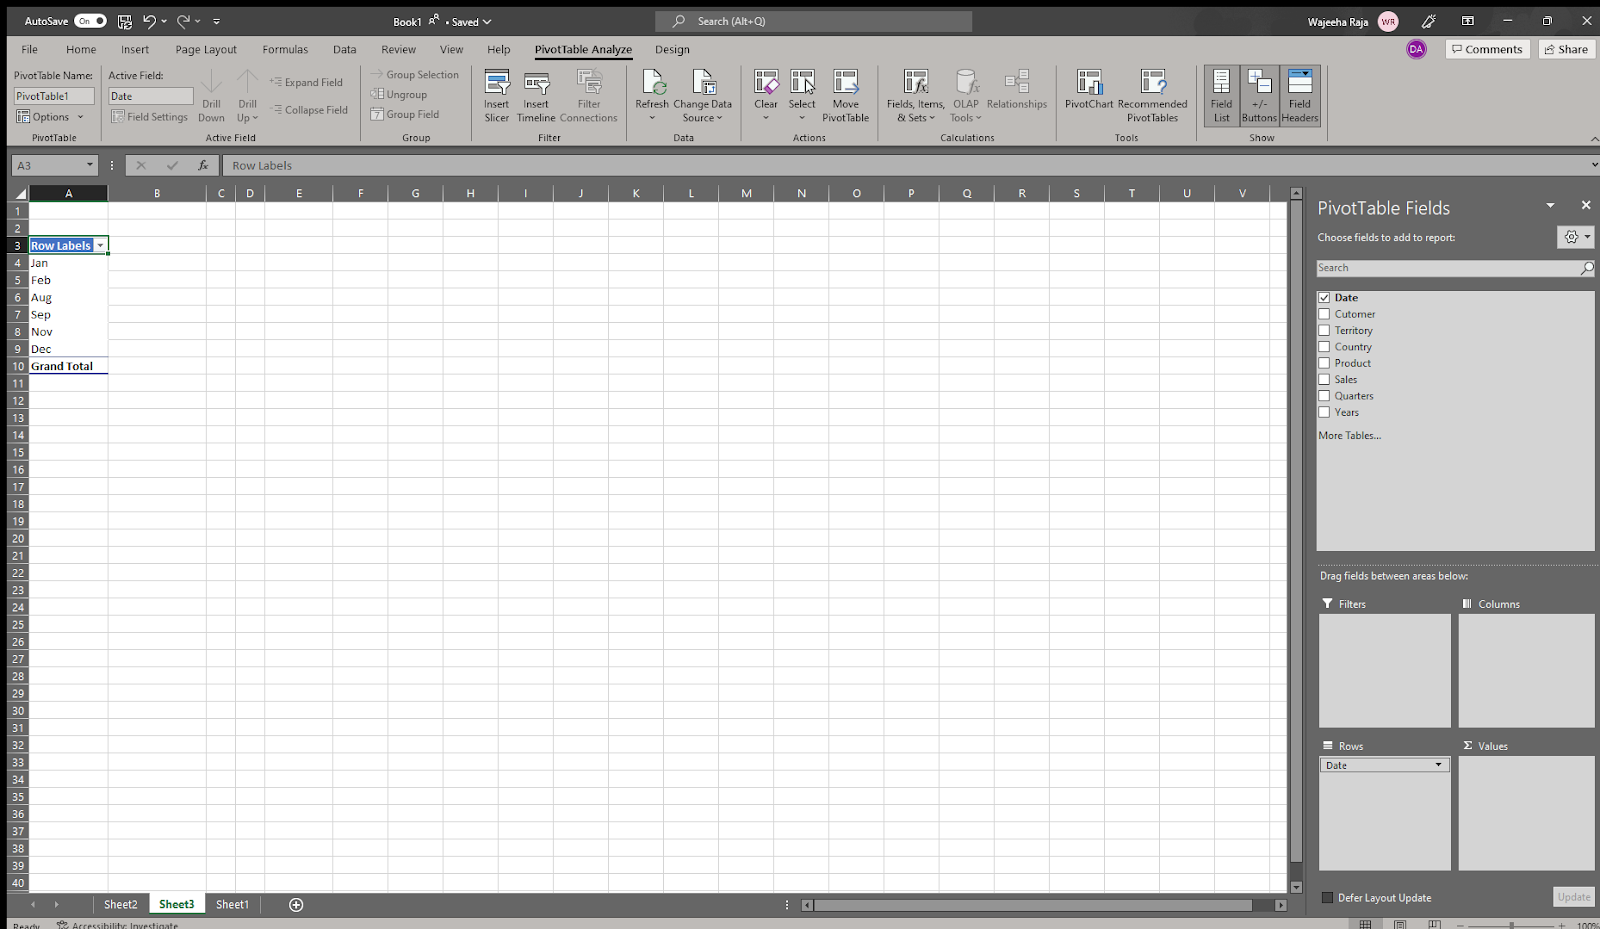
In order to have your report focused on showing quarterly sales, you need to check the “Quarters” tab. You should have a “Quarters” tab on it automatically. If not, you can simply change values by checking the “DATA” field. Then go to “Group Selection” from the “PivotTable Analyze” tab and click on “Quarters” in the “Grouping” dialog window.
Customizing the number format
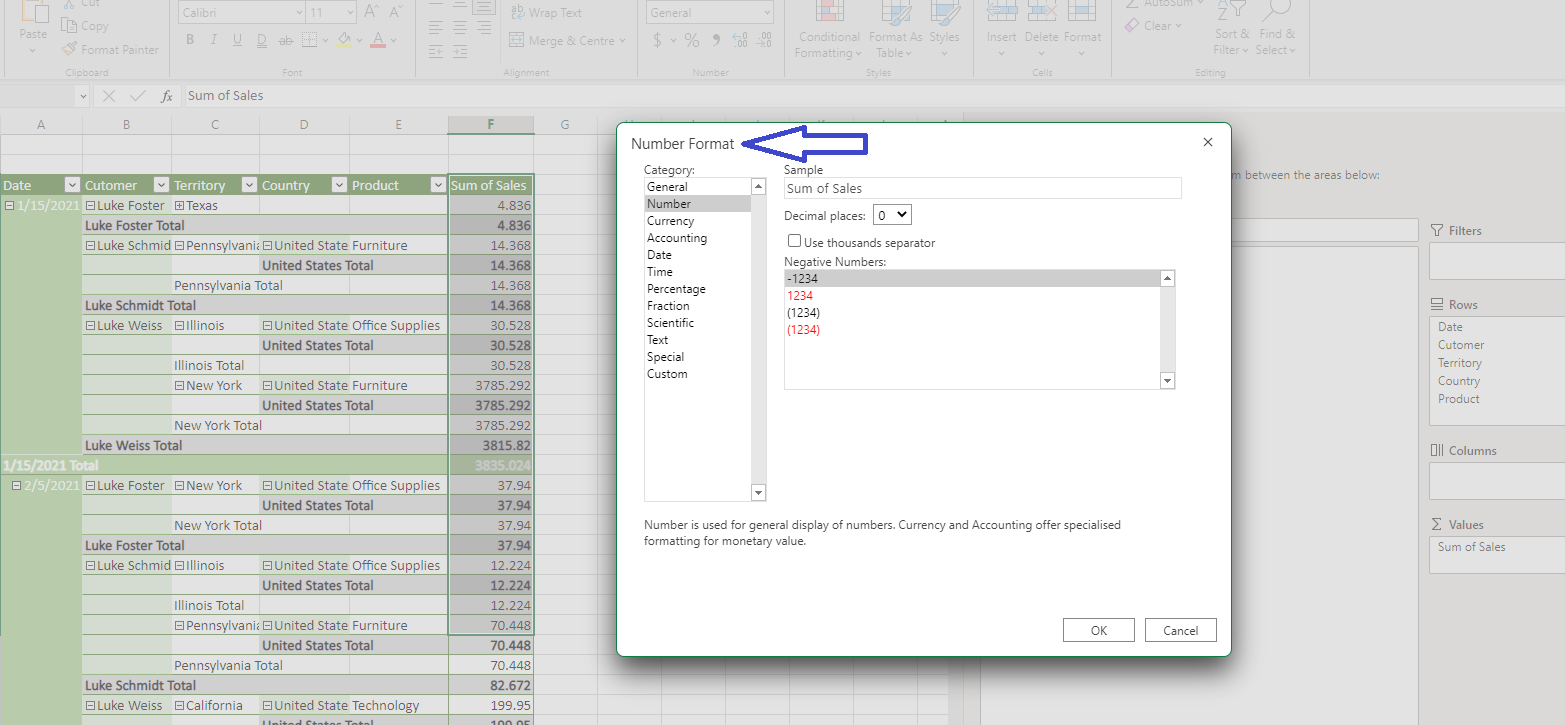
Customizing the number format can simplify your final report. The number format can be changed in multiple ways. The easiest way to do so is by clicking on any number of pivot tables that we generated and right-clicking on it, and it will open a drop-down menu where you can see the “Value Field Setting.”
After clicking it, the dialog box of “Number Format” will appear. It will have an option for adjusting decimal places. By check-marking “Use 1000 Separator” and putting Decimal places value to 0, and clicking “OK,” number formatting of the chosen column of the pivot table will be simplified.
Generating report displaying quarterly sales by territory
Quarterly sales reports can be represented in many ways. Different charts and table styles serve different purposes based on the data gathered, including leads, sales, volume in a specific territory, etc.
To generate a report displaying quarterly sales by territory, go to the “Grouping” option and only select “Quarters.” This will show you a pivot table mentioning sales in different quarters. This pivot table can be customized further to give the report a more aesthetic and visual appearance.
Conclusion
A good sales report can have a huge impact on your business’s growth as it can provide the data to make better-informed business decisions. This is one of the methods used to create a report that displays quarterly sales by territory. One of the prime benefits of using this method is that you can highlight or display specific sections in various forms depending on what you need to emphasize in your report.
Check how you can automate your sales to get better results.